When choosing a place to live there are a lot of factors that play into that decision. You want a good education for your children, but additionally living in a highly educated area has other benefits. More education means higher salaries, which in turn means economic growth and higher tax revenues. But what North Carolina cities are home to the most educated people? Well two of them made the top 20 of WalletHub’s latest list. The list is 2022’s Most & Least Educated Cities in America. Another NC city just cracked the top 30 as well.

How do you determine the most educated cities? WalletHub compared the 150 largest metropolitan statistical areas across 11 key metrics. They measured the share of adults aged 25 and older with a bachelor’s degree or higher. Then looked at this number against the quality of the public-school system to the gender education gap.

It wasn’t all good news for North Carolina though. Unfortunately, some cities also ranked towards the bottom of this list. Including Hickory-Lenoir-Morganton, NC coming in at 145 out of 150. Another major city, missing from this list was sitting at 53.

Two North Carolina Cities Rank In The Top 30 Most Educated Cities In The Country

  • 30. Lansing-East Lansing, MI

    Landing

    Lansing, Michigan, USA at the Michigan State Capitol during the evening.

    Total Score: 62.3

    Educational Attainment: 38

    Quality of Education & Attainment Gap: 26

  • 29. Urban Honolulu, HI

    Honolulu

    Beautiful rainbow over the Hawaii skyline

    Total Score: 62.49

    Educational Attainment:

    Quality of Education & Attainment Gap:

  • 28. Asheville, NC

    Asheville

    Asheville, North Carolina, USA at twilight.

    Total Score: 62.61

    Educational Attainment: 38

    Quality of Education & Attainment Gap: 26

  • 27. Hartford-East Hartford-Middletown, CT

    Connecticut

    Total Score: 64.07

    Educational Attainment: 21

    Quality of Education & Attainment Gap: 127

  • 26. Atlanta-Sandy Springs-Alpharetta, GA

    Total Score: 64.97

    Educational Attainment: 28

    Quality of Education & Attainment Gap: 20

  • 25. New York-Newark-Jersey City, NY-NJ-PA

    New York city

    NEW YORK, NEW YORK – APRIL 27: A view of the skyline from the Allspring Global Investments: New Brand Launch at PEAK at Hudson Yards on April 27, 2022 in New York City.

    Total Score: 65.23

    Educational Attainment: 27

    Quality of Education & Attainment Gap: 16

  • 24. Lexington-Fayette, KY

    Lexington

    Aerial view of Jacobson Park Lake and Richmond Road in Lexington, Kentucky

    Total Score: 66.17

    Educational Attainment: 23

    Quality of Education & Attainment Gap: 31

  • 23. Baltimore-Columbia-Towson, MD

    Maryland

    Total Score: 67.07

    Educational Attainment: 18

    Quality of Education & Attainment Gap: 118

  • 22. San Diego-Chula Vista-Carlsbad, CA

    San Diego

    Total Score: 67.13

    Educational Attainment: 25

    Quality of Education & Attainment Gap: 3

  • 21. Huntsville, AL

    Huntsville

    Huntsville, Alabama, USA park and downtown cityscape at twilight.

    Total Score: 67.41

    Educational Attainment: 24

    Quality of Education & Attainment Gap: 12

  • 20. Albany-Schenectady-Troy, NY

    Albany

    The New York State Capitol Building in Albany, home of the New York State Assembly. Monument of General Sherman on horseback.

    Total Score: 67.58

    Educational Attainment: 20

    Quality of Education & Attainment Gap: 83

  • 19. Minneapolis-St. Paul-Bloomington, MN-WI

    Minneapolis

    Image of Minneapolis downtown skyline at sunset.

    Total Score: 68.12

    Educational Attainment: 13

    Quality of Education & Attainment Gap: 116

  • 18. Tallahassee, FL

    Tallahassee

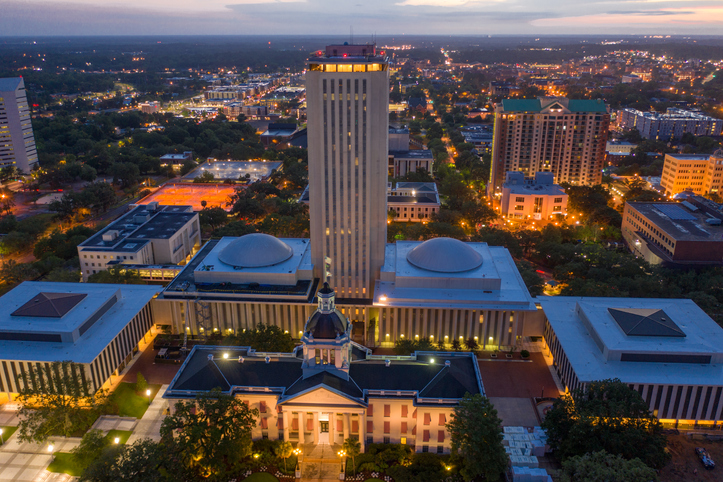
    Aerial photo Downtown Tallahassee Florida State Capitol

    Total Score: 68.47

    Educational Attainment: 22

    Quality of Education & Attainment Gap: 7

  • 17. Portland-Vancouver-Hillsboro, OR-WA

    Portland

    Portland, Oregon, USA downtown skyline with Mt. Hood at dawn.

    Total Score: 69.24

    Educational Attainment: 19

    Quality of Education & Attainment Gap: 50

  • 16. Portland-South Portland, ME

    Portland

    Portland, Maine, USA coastal townscape on Portland Harbor.

    Total Score: 69.58

    Educational Attainment: 16

    Quality of Education & Attainment Gap: 70

  • 15. Trenton-Princeton, NJ

    Trenton

    The capital statehouse of New Jersey lights up as the sun sets the Delaware River in the background city of Trenton

    Total Score: 70.11

    Educational Attainment: 15

    Quality of Education & Attainment Gap: 71

  • 14. Denver-Aurora-Lakewood, CO

    Denver

    Total Score: 70.78

    Educational Attainment: 12

    Quality of Education & Attainment Gap: 79

  • 13. Colorado Springs, CO

    Colorado Springs

    Garden of the Gods, Colorado Springs, Colorado, USA.

    Total Score: 71.64

    Educational Attainment: 14

    Quality of Education & Attainment Gap: 30

  • 12. Provo-Orem, UT

    Provo

    Aerial view of Provo City, Utah, Y Mountain, Brigham Young University, and surrounded neighborhoods

    Total Score: 71.73

    Educational Attainment: 17

    Quality of Education & Attainment Gap: 24

  • 11. Bridgeport-Stamford-Norwalk, CT

    Bridgeport

    Fayerweather Island, Black Rock Harbor, Bridgeport, Connecticut, lighthouse

    Total Score: 71.96

    Educational Attainment: 8

    Quality of Education & Attainment Gap: 146

  • 10. Austin-Round Rock-Georgetown, TX

    Austin

    Total Score: 73.84

    Educational Attainment: 11

    Quality of Education & Attainment Gap: 13

  • 9. Seattle-Tacoma-Bellevue, WA

    Seattle

    Panoramic view of Seattle cityscape and Space Needle at sunset, Washington, USA

    Total Score: 75.34

    Educational Attainment: 10

    Quality of Education & Attainment Gap: 14

  • 8. Raleigh-Cary, NC

    Total Score: 77.08

    Educational Attainment: 7

    Quality of Education & Attainment Gap: 44

  • 7. Durham-Chapel Hill, NC

    Durham NC

    Durham, North Carolina, USA downtown cityscape.

    Total Score: 78.06

    Educational Attainment: 9

    Quality of Education & Attainment Gap: 4

  • 6. Boston-Cambridge-Newton, MA-NH

    Boston

    Boston, Massachusetts, USA skyline over Boston Common.

    Total Score: 78.26

    Educational Attainment: 6

    Quality of Education & Attainment Gap: 47

  • 5. San Fransisco-Oakland-Berkeley, CA

    San Fransisco

    The crookedest street in the world Lombard street at dawn. San Francisco is lightened by morning sun.

    Total Score: 80.77

    Educational Attainment: 4

    Quality of Education & Attainment Gap: 17

  • 4. Madison, WI

    Madison

    Madison, Wisconsin, USA downtown skyline on Lake Monona in the daytime.

    Total Score: 80.83

    Educational Attainment: 2

    Quality of Education & Attainment Gap: 49

  • 3. Washington-Arlington-Alexandria, DC-VA-MD-WV

    Total Score: 81.78

    Educational Attainment: 3

    Quality of Education & Attainment Gap: 27

  • 2. San Jose-Sunnyvale-Santa Clara, CA

    San Jose

    Total Score: 82.03

    Educational Attainment: 5

    Quality of Education & Attainment Gap: 5

  • 1. Ann Arbor, MI

    Ann Arbor

    University of Michigan Law School, Ann Arbor, Michigan, USA. This campus is known as the Law Quad. The buildings show the Lawyers Club, a dormitory.

    Total Score:

    Educational Attainment:

    Quality of Education & Attainment Gap:

  • Methodology (From WalletHub)

    To identify the most and least educated cities in America, WalletHub compared the 150 most populated U.S. metropolitan statistical areas, or MSAs, across two key dimensions, including “Educational Attainment” and “Quality of Education & Attainment Gap.”

    We evaluated those dimensions using 11 relevant metrics, which are listed below with their corresponding weights. Each metric was graded on a 100-point scale, with a score of 100 representing the highest educational attainment and quality of education. For metrics marked with two asterisks (**), we used the square root of the population to calculate the population size in order to avoid overcompensating for minor differences across cities.

    Finally, we determined each metro area’s weighted average across all metrics to calculate its overall score and used the resulting scores to rank-order our sample.

    Educational Attainment – Total Points: 80

    • Share of Adults Aged 25 & Older with a High School Diploma or Higher: Full Weight (~20.00 Points)
    • Share of Adults Aged 25 & Older with at Least Some College Experience or an Associate’s Degree or Higher: Full Weight (~20.00 Points)
    • Share of Adults Aged 25 & Older with a Bachelor’s Degree or Higher: Full Weight (~20.00 Points)
    • Share of Adults Aged 25 & Older with a Graduate or Professional Degree: Full Weight (~20.00 Points)

    Quality of Education & Attainment Gap – Total Points: 20

    • Quality of Public School System: Double Weight (~4.44 Points)
      Note: This metric is based on GreatSchools.org’s ratings of U.S. public schools.
    • Average Quality of Universities: Double Weight (~4.44 Points)
      Note: This metric is based on WalletHub “College & University” rankings report.
    • Enrolled Students in Top 1,015 Universities per Capita: Full Weight (~2.22 Points)
      Note: This metric is based on WalletHub “College & University” rankings report.
    • Number of Summer Learning Opportunities per Capita**: Full Weight (~2.22 Points)
    • Racial Education Gap*: Full Weight (~2.22 Points)
      Note: This metric specifically measures the difference between the percentage of black bachelor’s degree holders and the percentage of their white counterparts.
    • Gender Education Gap*: Full Weight (~2.22 Points)
      Note: This metric specifically measures the difference between the percentage of female bachelor’s degree holders and the percentage of their male counterparts.
    • Education Equality Index Score: Full Weight (~2.22 Points)
      Note: The Education Equality Index (EEI) is a comparative measure of the achievement gap between students from low-income families, as measured by participation in the free and reduced price lunch program, and their more advantaged peers. The EEI compares the proportion of students from low-income families who are proficient on a state assessment to all students across the state who took that same grade or subject level assessment.

    *Additional context: In metro areas where women have an advantage over men and black people have an advantage over white people, we gave extra credit compared to the metro areas with no gender-based/racial inequality.

    Sources: Data used to create this ranking were collected from the U.S. Census Bureau, GreatSchools.org, Education Cities.org, Yelp and WalletHub research.

  • Smartest States

Make Sure You're Signed Up For The Kiss & Tell Newsletter

Get the latest celebrity and music buzz find out what's happening in Charlotte, plus exclusive contests, and more!

*
By clicking "Subscribe" I agree to the website's terms of Service and Privacy Policy. I understand I can unsubscribe at any time.